Coriolis sensors open lines to real-time data
Meters on suction, return sides of well can collect mass/volume flow rate, density in/out info for multiple uses
By Jason Norman, independent consultant for Apache Corp

Coriolis mass flow sensors are increasingly being used by drilling operators to measure drilling fluid density and flow-rate parameters in real time, whether on sixth-generation drillships or 30-year-old land rigs. Collecting density and flow-rate data in real time is helping to lower drilling costs by reducing nonproductive time (NPT) and identifying leading indicators to potential operational problems, which contributes to real-time drilling optimization.
The real-time data can be aggregated into the rig control system to display graphics with built-in alarm functionality, providing the driller and mud engineer with advanced notice of major changes to drilling parameters.
The rig control system provides data aggregation for all sensors to monitor every aspect of the drilling system.
Until recently, density and flow rate were not parameters that the rig control system measured in real time. Traditionally the mud pump stroke count was used to calculate flow rate entering the well, and density was measured by the derrickman or mud engineer – often only twice an hour. Flow rate exiting the well was normally measured using a paddle wheel-type of device that generally indicated only a percentage of flow in the flow line. Density was measured every 30 minutes from a sample point downstream of the shakers.
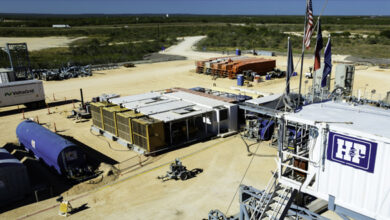
One innovative application for collecting flow and density data is by using Coriolis meters on both the suction and return sides of the well.
A Coriolis meter can be mounted in-line between the active mud tank and the mud pumps to measure fluid going into the well. A second Coriolis meter can be installed at the flow line to measure the fluid exiting the well. The cumulative mass of cuttings can be metered coming out of the hole to provide an electronic means of doing what has traditionally been referred to as “keeping an eye on the shakers.”

Applying Coriolis technology opens the door to using mass, volume and density in and out data to improve drilling operations.
Integrating the data accuracy and reliability of these two sensors into a real-time wellbore monitoring system process can provide drillers and mud engineers with a “live” tool to help mitigate problems in:
• Hole-cleaning efficiency;
• Quantifying sweep effectiveness;
• Monitoring the circulating bottoms up;
• Monitoring environmental compliance;
• Formation fluid losses;
• Enhanced kick detection;
• Ballooning; and
• Pump efficiency.

Dedicating one portion of the rig control system to the processing of continuous drilling fluids data would facilitate clear and concise displays of this information with early warning alarm indicators.
Coriolis mass flow theory
Coriolis has been successfully applied in a select number of drilling fluid property applications for enhanced kick detection, loss circulation detection and managed pressure drilling. Taking the concept of metering both the suction and return line to physically measure the full-stream density, volume flow rate and mass flow rate of drilling fluids presents several conceptual uses for the data.
Hole-cleaning efficiency
Although a variety of methods have been developed to estimate hole-cleaning efficiency, it remains a challenge to get a clear indication of how well the cuttings are being suspended and transported by the drilling fluid.

Comparing mass flow rate in and out of the well can theoretically provide a leading indicator of inadequate hole cleaning. The mass flow of rock generated at the bit can be calculated using the rate of penetration and hole size. This calculated mass flow of rock generated could be graphed in real time. A “look-up” table of bulk density log data from an offset well or the logging while drilling tool can be used to make this calculation as accurate as possible.
Using a totalized mass flow of drilling fluids in, plus the mass flow of rock generated (mass flowIN + mass flowOUT of rock generated) and subtracting that mass from the total mass of fluid exiting the well will theoretically tell what mass of drilled cuttings has not been removed from the well (Figure 3).
This data can be graphed on the same plot as the mass flow of rock generated at the bit. The real-time stream of data could provide the drillers and mud engineers with accurate information to help mitigate a potential drilling problem before it happens.

Common problems that could be more effectively managed through this concept include stuck pipe, excessive torque and drag, annular packoff, increased equivalent circulation density, loss circulation, excessive viscosity and gel strengths, poor casing and cement jobs, high mud dilution costs and slower drilling rates.
Quantify sweep effectiveness
Methods exist today to provide subjective or predictive assessments of sweep effectiveness to quantify the mass of cuttings removed by the sweep and to determine if the sweep added value to the drilling operations.
Quantifying the effectiveness of a sweep can be theoretically computed based on the density. As shown in Figures 4 and 5, the difference between the DensityIN of the sweep and the density of the sweep on the returns side DensityOUT would be proportional to the amount of cuttings removed. Trend characteristics of the return density could also be an indicator of sloughing or that the sweep has been strung out.

Using density measurements from the Coriolis meters could help to determine if a sweep is adding any significant value, thereby providing better information to determine the type and frequency of sweeps and helping to increase rate of penetration.
Monitor circulation bottoms up
Quantifying the volume of cuttings exiting the wellbore immediately after “bottoms up” is a common problem that contributes to NPT because of unnecessary circulation time, although it is rarely logged as NPT.
Monitoring the density of fluid exiting the well at target depth can provide a clear indication that it is safe to pull out of hole. It is possible to accurately quantify if circulating more than bottoms up is necessary, removing unnecessary circulating time (Figure 6). The trend line of the DensityOUT could also provide indication of sloughing because of poor cuttings transport.
Environmental compliance monitoring

Uncertainty in identifying the oil/water interface during a synthetic-based mud (SBM) wellbore displacement can result in unnecessary volumes of fluid being generated for treatment and disposal.
Coriolis meters can aid in environmental compliance monitoring by helping the mud engineer minimize the volume of “slops” generated during SBM displacement operations. Normally a weighted brine pill or spacer is pumped ahead of the SBM. Once the brine pill is displaced back to surface, the SBM/water interface will be monitored and can help the mud engineer to identify the optimum time to close in the system (Figure 7).
A more precise prediction of when to close in the system can help to minimize the volume of slops.
Formation fluid losses and kick detection

Real-time, accurate and reliable fluid volume measurements are required to recognize and mitigate fluid losses and kicks. Comparing pump strokes for downhole flow rates to paddle meters on the return side or mud pit level presents several challenges to the accuracy, reliability and lag times in recognizing barrels in barrels out volume changes.
Comparing the return flow out of the well to either pumps stroke volumes or to another Coriolis meter on the suction side of the mud pump can provide an effective means to monitor formation losses.
Formation losses can be monitored in real time by subtracting the flow rate out (VolumeOUT) from the flow rate in (VolumeIN (Figure 8). Any volume of fluid not returned to surface can be considered a formation loss. A portion of fluid is lost to spurt to build a filter cake; the rest is considered normal seepage loss and will contain some proportion of solids and liquid.
Real-time, accurate and reliable fluid flow data is also essential to detect abnormal loss circulation and minimize problems, such as wellbore instability, stuck pipe, poor formation evaluation and even blowouts.
The same in and out Coriolis flow data can be used for enhanced kick detection. Current practices involve comparing pump stroke-based volume to returns flow and is commonly used in managed pressure drilling systems. The same application is being applied to conventional and rotary head rigs where hydrostatic pressure in the returns line is used to maintain flow in the meter.
Ballooning

Coriolis meters can also help to monitor ballooning. The deepwater phenomenon of ballooning has been identified as the slow loss of mud while drilling ahead, followed by a more rapid mud return after the pumps have been turned off.
Understanding this totalized volume of formation losses can help drillers better distinguish between an influx kick and normal ballooning effects to avoid costly well control procedures (Figure 9).
Monitor ‘total fluids management’
The measurement of mass flow at the return flow line could also be incorporated into fluids and waste management activities. This could include providing inputs to calculate dilution economics and solids control system performance.
• The overall performance of the solids control system will be based on the overall removal of rock mass from the well. The information will provide an indicator as to how much cuttings is left in the well.
• The mass of rock removed from the well will provide a good indication of the volume of waste being transferred to disposal.
• The volume of low-gravity solids left in the mud system will provide an indicator of how much dilution will be required to TD the well.
The wellbore column of fluid is independent of the surface system. Therefore, any powder products or liquid additives transferred into the active system does not have any bearing on the mass balance of fluid being circulated through the well in real time.
The excavated volume of drilled cuttings becomes the only “additive” to the column of fluid – unless an influx of water is taken from the formation. This mass balance monitoring of the well should be in conjunction with pressure while drilling (PWD) data, torque and drag analysis, as well as pick-up/slack-off data to provide some confidence level indicator that the hole is being adequately cleaned.
Conclusion
Real-time data collection of mass/volume flow rate and density in and out of the well offers innovative ways to use information to further enable accurate optimization of drilling parameters. Overcoming the technology challenge of obtaining reliable, accurate and continuous measurements provides invaluable data to extend the technical drilling limit by optimizing the rate of penetration.


HiJason
Great article. hope everyone sees the value in this as this is where the industry is headed
Look forward to seeing more from you!!!
Good article. I have used Coriolis on our HPHT development here in Vietnam. However, it was used with an MPD packer, which created more problems than we expected. We are now looking at a 10″ Coriolis from Slb, for our 12.25″ and 8.5″ sections. (1000-GPM & 700 -GPM resp.) Our flow line and shaker vertical height difference in in the order of 3m, so can only give a head pressure to the Coriolis of ~ 10-psi. I worry that this is not sufficient pressure to drive the Coriolis and produce accurate monitoring. We await specific information from slb before deciding to go ahead. Has anybody used this Slb Coriolis with similar size and hyd head pressures.? What was the accuracy and reliability of the system? Ian
Good article. May I know the size of the coriolis used in the example and return flow line pipe size?
Hi Ian,
What problem you encountered when using coriolis flowmeter in Vietnam?
Please share the current progress as well for your installation.
Thanks.
We worked with Jason 2012/13 on this aspect of a larger project. The Coriolis is amazing but hampered by OBM entrained gas and occasional blocking (even the 10″ straight tube Corilis). We still believe its the best instrument for mud-in data.
We were testing the metering spool developed for partially-filled unpressurised mud-out flow line. It worked well but needs tweaking. We got non-contact accurate vol GPM, mass PPM and density PPG.
I have had some questions about the “metering spool developed for partially-filled unpressurised mud-out flow” that I mentioned in my previous post. It is called MudMaster and has come on a generation since the post. Some detail on the system is available on the able.co.uk site but latest info, early-kick features, data and reports may be subject to NDA.