Deconstructing invisible lost time: KPIs, analytics, standardization improve well deliveries in Bakken
Nabors partners with operator to implement five-step standardization methodology to mitigate ILT, reduce average well delivery times
By Chakra Mandava, Joey Husband and Michael Lockridge, Nabors Drilling Technologies USA

A data-driven contractor-operator initiative that aimed to mitigate inefficiencies in the well construction process resulted in a “CAPEX-free” opportunity to safely reduce unconventional well delivery times by up to 40%. The joint initiative, which focused on North Dakota’s Bakken Shale play, underscored the tangible benefits of standardizing drilling operations and monitoring key performance indicators (KPIs) to consistently reduce invisible lost time (ILT). Unlike downtime, ILT never appears in the standard morning report. Rather, it is hidden inefficiencies and inconsistencies in routine drilling operations where performance in standard processes can often swing widely between crews.
Eliminating ILT in key drilling processes to reduce well delivery times is particularly beneficial for the cost-sensitive and high-intensity unconventional market. Here, even modest reductions in drilling time, in concert with strict adherence to optimal HSE standards, can enhance economic margins appreciably.
The increased attention to ILT reduction is part of the industry’s larger initiative to reduce rig downtime to as low as 1%, which only a few years ago was largely seen as an unreachable ambition. Much of the improvements in downtime can be traced to advances in equipment condition monitoring (ECM), predictive analytics and the latest generation of remote monitoring and troubleshooting. Nabors’ proprietary software provides a range of instrumentation, ECM and data analytic solutions, which seamlessly interface with a remote operating center in Houston. The RIGLINE 24/7 facility enables remote monitoring of approximately 300 Nabors and external customer rigs, where sensors provide immediate alerts for any operational issues that may require corrective actions.
Taking on ILT
Today, on average, less than 5% of a well delivery timeline is attributed directly to downtime, arising from drilling hazards, equipment failures and the like. Conversely, roughly 80% of an average shale well delivery time is related to five key operations: drilling, tripping, rig moves, running casing and mud circulating/conditioning. A typical drilling program assigns each of these operations a target speed/rate. As the ILT percentage represents the shortfall between the target and actual times, closing the gap between the two values would significantly reduce overall well delivery times and costs. Therefore, improving performance on these five operations has taken on more weight, especially given the volatility in the current commodity price climate.
Accordingly, heightened focus has been directed to measuring ILT by analyzing the individual KPI assigned to particular operations and crew (drilling, casing, etc), where disparities can be identified and addressed through increased training or other corrective measures. Importantly, the KPI selection, along with defining and readjusting appropriate benchmark targets and flagging non-conformance events, represents the first step in measuring ILT.
More than three years ago, Nabors began looking closely at ILT percentages to review performance across shale plays and the associated drive toward factory-style drilling strategies. The ILT mitigation initiative focused on standardizing key processes, each with designated and regularly monitored KPIs. The ultimate aim was to instill consistency among the crews that could be replicated across the entire rig fleet, thereby enhancing performance and reducing the operator’s well construction time.

To fully identify the inefficiencies in rig performance, more than 400 unconventional wells were analyzed. Integral to the investigation was the classification of operational activities to better understand the extent to which the drilling contractor, operator or third-party service provider affects the respective processes.
The processes are broken out into three basic categories. The first category includes processes that are fully controlled by the drilling contractor; this was documented as comprising 15% to 25% of total well time. The second category was limited-controlled processes, such as between formation considerations, operator-specific policies and practices and third-party activities. This category accounts for an average 25% to 35% of well time. Between 30% to 40% of well time is tied to the third category – “other processes” – in which the drilling contractor has very limited or zero control. These processes primarily depend on the lithology and well design, as well as the practices and policies specific to the operator and/or other third-party service contractors.
Analytics-based tracking
With respect to both frequency and precision, rig-site performance monitoring has evolved exponentially over the years from manual ad-hoc reports to advanced near-real-time automated analytics. The result is considerably improved transparency in crew performance, particularly with respect to monitoring KPI trends.
Nabors’ rig data software consolidates near real-time drilling, tripping PVT and measurement-while-drilling (MWD) data, which are automatically filtered, analyzed and converted into KPIs. The KPIs, in turn, are compiled into user-friendly dashboards and reports available to field and office personnel for both the operator and contractor.
ECM is provided for top drives, generators, mud motors, MWD tools and other critical components affecting rig performance. The proprietary system monitors the operational health of equipment in real time. Any issue is accompanied with an immediate e-mail to applicable personnel and with a flashing alert in the remote operating center to ensure corrective actions are taken promptly. This instantaneous capability serves to reduce run-away downtime incidents from potentially catastrophic equipment failures.
These and other advanced analytics figured prominently in the multi-operator analysis of 400 unconventional wells Nabors had drilled in the Eagle Ford, Haynesville and Bakken shale plays. As intended, the evaluation deepened the understanding of what drives inefficiencies, while concluding that 30% to 40% of rig time could be saved through ILT reductions.
Bakken multi-rig analysis
Focusing on the Bakken, the ILT study covered a cumulative 170 wells drilled between the first and third quarters of 2016 for 10 major operators.

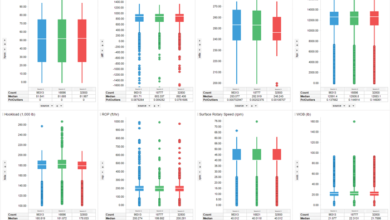
While the study encompassed all KPIs selected for an individual well, this examination highlights only the four key metrics offering the highest potential for improvement: cased-hole tripping speed, tripping connection time, ROP and drilling connection time. The data showed a variance of 40% to 50% between the best and average crews for each of the examined metrics. Drilling down further:
• Cased-hole tripping speed average was documented at 2,730 ft/hr, with values ranging from 2,100 to 3,400 ft/hr.
• Tripping connection time averaged 1.3 min, ranging from 1.1 to 1.4 min.
• ROP averaged 155 ft/hr, ranging from 115 to 190 ft/hr.
• Weight-to-weight drilling connection time averaged 9.5 min, from overall values between 6.6 and 13.2 min.
Of these four metrics, the analysis showed ROP and drilling connection times represent a good opportunity to improve efficiency, with wide variances between the lowest and highest performers.
Aside from these key metrics, the analysis suggested that an aggregate 68 hours conceivably could be shaved off of average well delivery times. This could be done by improved and consistent efficiencies in casing/cementing, BOP work, circulating and ancillary operations, such as reaming, logging and wellhead work, which alone could achieve a potential 34-hour time savings.
By successfully improving the performance of each of these metrics, the study concluded well times could be reduced by 35% to 40%.
To further refine the opportunities to optimize efficiency, Nabors partnered with one of the more active Bakken operators to develop the ILT mitigation initiative. The initial focus was to standardize those operations controlled primarily by the rig contractor.
The ILT analysis of the operator’s Bakken wells confirmed a potential time savings of 45 hr/well through improvements in ROP and drilling connection times, while 8 hr/well could be saved by faster tripping and connection times. This translates to the operator’s ability to reduce total well times from an average of 15.4 days to 9.7 days.
Beginning with select pilot rigs, the five-step initiative was performed across the operator’s entire Bakken fleet with the aim of validating scalability across multiple rigs.
Five-step methodology
Building the model began with the operator and drilling contractor identifying the primary parties to be responsible for the initiative on the contractor and the operator side. The subsequent establishment of definitive roles and responsibilities, including crew training, brought the key groups into alignment and deepened understanding as to how their respective activities would drive overall performance.
From there, development of the standardized model followed five sequential steps:
• To advance standardization of the process, the operator deconstructed the target well into 19 key steps, beginning with nippling up the BOP and continuing through to the installation and testing of the night cap.
• The scope of work (SOW) was then aligned with a corresponding KPI to enable the progress of each step to be analytically tracked and measured. The respective KPI reflected the operations that comprise the majority of well delivery times, specifically tripping speed and tripping connection, drilling connections, ROP, BOP work casing/cementing, etc. For instance, drilling of the vertical, curve, shoe track and lateral sections were accompanied with benchmark ROP and drilling connection time KPI.
• As a next step, standard procedures to complete each of the 19 steps were documented. Utilizing significant input from the client’s team, the detailed procedure identified best practices based on accepted engineering and operational expertise. These include, for example, the procedures to be followed while making a drilling connection and getting back to bottom, to rig up and run casing, and drilling a curve section. Procedures were documented based on best practices to reduce downtime and improve performance.
• Once the standardized procedures were documented, the ILT initiative was rolled out in four phases, each with designated contractor and operator-specific activities and corresponding deliverables. In the initial phase, the KPI targets were determined and the target rigs selected. The second phase of the systematic rollout entailed the introduction of the standardized procedure, complete with a finalized communication and crew training plan, to the pilot rig. Over the final two phases of the field roll-out, the procedures were systematically tracked, updated appropriately and redeployed across the operator’s entire rig fleet. Based on rig-site feedback from contractor and client personnel, the processes and targets were revised quarterly, as applicable, with performance on all rigs reviewed regularly.
• The final and ongoing phase of the methodology rollout entails regular monitoring of KPI trends to ascertain both the performance improvement and performance consistency between tours.
Results and observations

Since its implementation, the standardization process has seen significant improvements in all KPIs monitored, with corresponding decreases in the ILT percentages across the fleet. Importantly, inter-tour consistencies were readily observable across all the metrics measured, signifying the wholesale buy-in of all rig and associated crews.
One striking improvement was the consistent decline in drill connection time from 9.9 min at the start of the initiative to 6.7 min. Corresponding ROP, likewise, increased from 180 ft/hr to a 194 ft/hr average, which remained stable over two quarters.
Elsewhere, although cased-hole tripping speed increased from an average of 2,690 ft/hr in Q4 2015 to an average 2,710 ft/hr by Q3 2016, the results disclosed room for significant improvement in consistency. In the first and second quarters of 2016, tripping speeds averaged 2,684 ft/hr and 2,755 ft/hr, respectively. Conversely, tripping connection time demonstrated consistent quarter-over-quarter improvement, from 1.28 min to 1.18 min.
Together, the results suggest that continual and consistent improvement in the key processes could reduce the operator’s Bakken well delivery times from an average of 15.4 days to around 13 days, which would represent an estimated 15% improvement in well delivery times as of Q1 2017.
Moreover, a more discrete but no less impactful outgrowth of the process standardization and KPI monitoring initiative was the fostering of a crew-centric culture driven to achieve operational excellence. From a contractor’s perspective, the exercise clearly illustrated the inherent mutual benefits achieved through nurturing closer working relationships with operators. DC
This article is based on a presentation at the 2017 IADC Drilling Onshore Conference, 18 May, Houston.