Dashboard concept aims to facilitate diagnostics, decision-making on BOPs
High-level ‘traffic light’ status would allow users to know when critical functions are impaired
By Jim McKay, Allen Pere, BP; Clayton Simmons, Mike Doty, National Oilwell Varco; Tony Hogg, Ensco; Gavin Starling, Rock Oilfield Group
As every motorist knows, a vehicle’s dashboard is an important interface that alerts the driver of real-time changes regarding certain car engine “health” metrics and alerts the driver that the engine may need to be serviced. While not a diagnostic tool in and of itself, the dashboard serves to alert the driver that a performance or health issue may exist.
Blowout preventer (BOP) equipment is designed to secure the well, and a BOP’s health is critical to ensuring that it works as designed. A real-time BOP dashboard can improve communication between operations personnel, rig contractor subsea engineers and the original equipment manufacturer (OEM) to assess potential BOP health issues.
This article describes a development process for a BOP dashboard and discusses the potential benefits, challenges and lessons learned associated with implementing a BOP monitoring system.
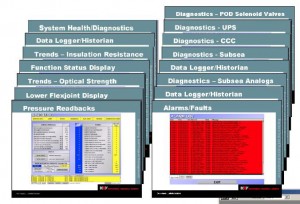
Traditional multiplex (MUX) BOP control system diagnostics (Figure 1) are designed by OEMs for use by personnel proficient in BOP control systems, such as a rig contractor’s subsea engineer. Control system diagnostics are generally geared toward maintenance and troubleshooting system problems more than operational decision-making.
Traditionally, the BOP diagnostic data is solely available at the rig-based engineering work station (EWS), also known as the event logger. Historically BOP data is not exchanged to shore from the offshore event logger. The industry could benefit from having BOP control system integrity or BOP health presented in a manner that allows operations people (offshore and onshore) to participate in communication with BOP experts to assess any risk associated with the BOP and the BOP control system.
The Concept
The BOP dashboard (Figure 2) aims to simplify complex BOP diagnostics in an easy-to-understand format that facilitates a joint assessment of the issue. In early 2011, BP, Ensco and National Oilwell Varco (NOV) collaborated on a project to consider preliminary development of a BOP dashboard that takes existing alarms, analog data and events from the BOP EWS and translates them into a high-level “traffic light” status. The traffic light logic is based on levels of system redundancy that allow the user to understand when critical functions are impaired.
The first phase of the project focuses on the electrical components of the control system, with further extension to the hydraulic components in the subsequent phases of the project. Although the initial dashboard would rely solely on the NOV eHawk platform, the end product could be a BOP monitoring dashboard incorporated into a mud-logging network.
When integrated with the common mud-logging database, the BOP data could be interconnected with other real-time well construction systems, such as digital BOP pressure-testing technology. If a BOP health issue should arise, the OEM web platform can provide additional layers of detail beyond the dashboard.
These additional layers should provide the user the same screens that are already available in the offshore BOP diagnostic system. Such a system can also be designed to allow near real-time archiving of raw BOP data on an onshore computer and can produce a BOP health report.
Although this system is not designed for or intended to be used for continuous monitoring, the end user can view the dashboard at any time, and reports summarizing alarm and event information can be sent automatically to select users.
Thus, this system could be a useful tool for well-site leaders (including the company man), offshore installation managers or shore-based operations teams. For example, operations teams could use this system to review applicable BOP health attributes prior to each daily rig call.
Software, Hardware Development and Installation
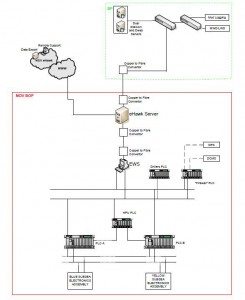
In this project, the EWS must be configured to allow for data export to the eHawk server. Although historically SQL data was used, NOV determined that the interoperability standard for automation (OPC) provided advantages for configuration. OPC has the ability to queue data and push an initial state for BOP positions and outstanding alarms. This is important when data transfer is lost or upon initial installation of the BOP monitoring system. OPC simplified the configuration by not requiring manual entry of outstanding alarms and initial positions into the eHawk database.
Figure 3 shows a simplified system diagram of the connection between the EWS, the eHawk server and the relevant Sitecomm server.
For the installation, NOV had to update the OEM drawings to show the new connection from the EWS and the eHawk server. The BOP control system had to be recertified from American Bureau of Shipping to reflect this change.
‘Traffic Light’ Development
The OEM holds the unique system knowledge required for traffic light logic development. For example, the OEM can provide guidance on the meaning of alarms and system redundancy. The operator and rig contractor can define the levels of risk that would be associated with each level of traffic light.
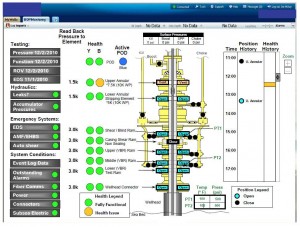
Originally three automated tiers of colors were envisioned to provide the health status of the BOP. “Red” status would mean no functionality, “yellow” status would mean functional but no redundancy, and “green” status would be fully functional and with redundancy.
As the BOP owner, the rig contractor may wish to retain the ability to manually change the traffic light severity due to the potential for false-positive or false-negative traffic lights. For example, it is possible that due to interdependencies between alarms, a minor alarm could also trigger a more severe alarm. In those instances, the dashboard traffic lights can be manually changed from a more severe status to a less severe status. The manual override can be done for a specific alarm, and the related traffic lights will be identified by an “F” indicating the traffic light was forced to a more or less severe status. To manually force or clear any alarm, the user is forced to enter a description that details the reason for the force.
In addition to a management of change process, this information allows for future review and oversight. The forcing of alarms, not traffic lights, allows subsequent alarms to change a traffic light status with an “F” to an increased severity level.
In addition, the user can scroll over a traffic light to view the outstanding alarms and to identify those alarms that were forced.
Different parts of the control system may have different levels of redundancy. In this project, at a minimum, redundancy for a specific BOP function is required for the traffic light to be green. An example of redundancy is the use of dual pods (yellow and blue). An example of dual redundancy would be communications to the pods. Each pod receives redundant communications, and the pods themselves are redundant; hence each pod receives a spare communication link to the surface control system.
For the BOP system, if the component is shared by the pod, then redundancy is required. If the component is specific to the pod, then redundancy is not required.
The current traffic light logic development used in this project omitted alarms related to the hydraulic system data (Phase II) or minor alarms (e.g., stuck push button alarms).
Dashboard GUI Development
When developing the graphical user interface (GUI) for the dashboard, the target users were assumed to include both experienced subsea engineers and those on an operations team with only a rudimentary knowledge of the BOP control system.
Starting in the top left of the dashboard and working to the bottom right, the following design requirements were built in the dashboard for this project:
• Top left – The last test date for auditing purposes will be manually entered and recorded.
• Upper left – Leaks and hydraulic issues will be detected with logic (Phase II development) and reported with a traffic light status.
• Lower left – Emergency systems status will be based on the solenoid valve health.
• Bottom left – Event log data will capture raw commands in a table with volumes, times for the activation and the location of the command.
• Bottom left – Outstanding alarms will capture raw alarm data, the time of the first alarm, the number of alarms in the last 24 hours, time of the last alarm acknowledgement and location of the last alarm acknowledgement.
• Bottom left – MUX fiber will report multiplex fiber health based on existing alarms.
• Bottom left – Surface alarms and subsea alarms will report all alarms and sort them based on the location of the equipment. This will allow the user to understand if the BOP stack should be pulled in the event of a yellow health status on a specific BOP function. These are envisioned as all-inclusive alarm traffic lights regardless of redundancy or alarm severity. This will also allow the user to understand if a minor alarm has been triggered.
• Middle left – Read back pressures will report the analog pressure for each specific function closing pressure. For example, this will allow the user to understand if the closing pressure was increased to obtain a seal.
• Middle – BOP function health separated by yellow and blue pods. Each major BOP function will have a displayed traffic light health indicator for each pod. The active pod will be indicated by a traffic light that is 50% larger than the non-active pod.
• Middle – BOP positions will be viewable by colored circles and blocks that animate physical position of the rams, annulars and subsea BOP valves.
• Right – Chronology log will display the positions and the overall health of the system over a 24-hr period. If the user is not constantly monitoring the BOP dashboard, they can look back at a high level to understand if the BOP was functioned or if there was a BOP health issue.
Monitoring and Decision-Making
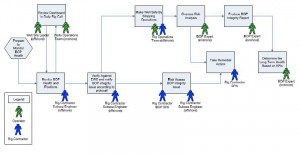
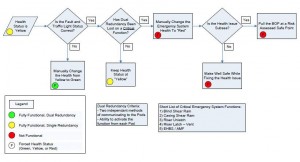
The real-time BOP dashboard will only be used as a communication tool by facilitating conversation between operations teams on BOP health issues. The primary diagnostic system will remain the original rig-based OEM EWS. The workflow process (Figure 4) requires that the EWS be used to confirm the dashboard before making any decisions.
One item that the project considered in the workflow process was the need to avoid uncontrolled distribution of data to individuals that may not fully understand the significance of various alarms. Not all alarms are equally important, and this distinction must be addressed when working with the dashboard.
Part of the pilot intent is to develop a decision tree protocol (Figure 5) where operations teams can make standard operation decisions. This will help eliminate the potential for subjective BOP health resolutions. Ideally, all BOP health scenarios would be mapped with a decision tree; however, it is more realistic to assume that some alarms will not fully reflect the true health of the BOP.
Once an alarm is triggered, the rig crew will need to confirm the BOP health issue by troubleshooting the issue. For example, if a MUX fiber signal triggers an alarm indicating fiber degradation, the crew will be able to perform a decibel loss test to confirm the issue.
For this version of the console, the decision protocol was set at a level to allow operations teams to determine the health status and remedial action. By allowing the user to manually change the health rating, the user can override the automated traffic light logic.
In time, as the diagnostic system and traffic light logic is accepted by the operations teams, the ability to manually override the BOP health status may be eliminated. For example, a future operations decision tree could have a defined scenario that requires the BOP to be pulled if a blind shear ram solenoid valve becomes inoperable.
Pilot Program
The milestones for the pilot program will be:
1. Sending alarm and event data back to shore.
2. Developing a working dashboard.
3. Potentially using the dashboard for decision-making and learning from that experience.
As stated previously, Phase I of the technology will focus strictly on the MUX electrical system; however, Phase II will include hydraulic diagnostics.
Digital security processes and hardware are long lead items that require careful planning for the first installation. An installation plan cannot be finalized until rig surveys are complete. The monitoring system can only be installed between wells when the BOP is on surface.
The major challenge and learning in this pilot program will be when the rig contractor and operator disagree on the BOP health status or the proposed remedial action of a BOP health issue. As this technology is adopted, it is anticipated that these situations will be addressed through agreed upon policies and procedures or decision trees.
The Way Forward
The hydraulic system will be addressed in Phase II by creating high-level traffic lights for leak detection and pressure vessel health. Leak detection methods include mix pump cycles, hydraulic fluid usage and flow measurements. In addition, each BOP function uses a specific volume that can be measured and compared with a previous baseline for leak detection.
Advancing the diagnostics with better sensors or algorithms will further develop the BOP dashboard. Ram position sensors, tool joint position sensors, BOP cameras and additional BOP wellbore pressures are examples of potential sensor upgrades.
The BOP dashboard data can eventually be integrated with the digital BOP pressure testing. This will allow the rams that were functioned to be identified for the pressure-testing data. Numerous key performance indicators (KPI’s) also can be calculated as more real-time data is gathered. For example, the number of cycles on a solenoid valve or the frequency of successful annular pressure tests can be captured.
These KPI’s and other collected data might eventually be shared amongst the industry through existing organizations, such as Offshore Reliability Data. This collective industry data can provide more robust fault tree analysis that could potentially provide real-time probability of “failure on demand” when certain functionality is lost.
Drilling Contractor Perspective
As the “big crew change” begins, more and more of the highly experienced subsea engineers are transferring to shore-based, or auditor-type, positions, challenging the industry to develop competent replacements. A well setup dashboard, supported by an agreed detailed decision tree, will allow these shore-based experts to better assist the rig-based subsea engineers to diagnose any problems, to discuss the issues with their client counterparts and to decide the most sensible path forward.
The BOP dashboard will not reduce the need for development and training of the rig-based subsea engineers. The BOP dashboard can only report the “health” of the system. It cannot, by itself, do anything to maintain its condition; this has to come from the allocation of sufficient time and resources, between each well, to properly maintain and test all of the subsystems.
This equipment can only be maintained and operated to the standards to which it was designed and manufactured (API 16D 2nd Ed.), regardless of the ease of monitoring afforded by the BOP dashboard. Improvements in BOP and BOP control system designs by the OEMs will be important factors in realizing future reliability enhancements.
OEM Perspective
Transferring the most up-to-date and accurate information back to the OEM allows the company to design more reliable equipment, as well as provide appropriate support to the customer. In the past, this was done over the phone, by email or required travel to the rig. Using this tool, OEMs can look at BOP information in near real time and better assist in decisions regarding the safe and proper operation of the equipment.
Summary
A BOP dashboard that simplifies existing diagnostics and allows for remote monitoring of the subsea BOP control system will improve communication of BOP health. Future deployments of the BOP dashboard could serve as a common platform across rig fleets that allow standardization of BOP diagnostic data and aids in operational decision making.
This article is based on IADC/SPE 151182, “Blowout Preventer (BOP) Health Monitoring,” presented at the 2012 IADC/SPE Drilling Conference and Exhibition, San Diego, Calif., 6–8 March 2012.




It would be nice to see these monitoring system in its testing phases. If it has capabilities to identify the health of the BOP prior to the failure or near failure, it may prove to be a huge benifit i.e. avoid costly repairs and downtimes.