Real-time sensor solutions provide greater transparency in fluids, solids management
Sensors installed in mud tank and along flowline enable data-driven analyses of solids composition to drive better decision making
By Stephen Whitfield, Senior Editor
Drilling fluids touch everything in the well construction process. The monitoring of flow rate, density, low- and high-gravity solids content and controlling these parameters at programmed spec is essential for optimal fluid performance. This leads to efficient hole-cleaning monitoring, which can also help minimize typical failures of surface and downhole equipment.
“Drilled solids management is all about mitigating or avoiding risk at the highest levels when planning the well,” said Jason Norman, Technology Development Director – Drilling Instrumentation/Automation at Absmart, a drilling fluids digitization company. “Nobody wants to experience a loss of well control. They plan for it and it’s part of their risk management matrix, but nobody wants to have any such avoidable incidents that can compromise the health and safety of their people or the environment.”
Real-time sensor technology can help operators gain better insights into the drilled solids composition within the drilling fluid. Over the past several years, Absmart has been developing sensor solutions that help make real-time concentration measurement a reality. It began by offering three new sensor traces for use at multiple stations within the circulatory system, along with its own data analytics platform, to create a comprehensive system of measuring a compositional material mass balance on the well in real time.
“It’s not just about the drilled solids; it’s the percentage of oil, percentage of water, the emulsifier, lime, barite and so on. It’s where all your fluids are going in real time. All of that is important to measure,” Mr Norman said.
Updating the old approach
Traditionally, operators have only used sensors to measure the volume of fluid in the mud tanks, flow paddles for measuring the flow rate in the flow line, and stroke counters to measure flow rate at the mud pumps. To measure the solids content within the mud, mud engineers rely on measuring conventional mud balance and on retort tests, in which a mud sample is heated until the liquid is vaporized, leaving only the solids remaining.
While these measures are effective at providing a general picture of solids concentration in the drilling fluid, having the ability to measure compositional concentrations in real time would provide a valuable tool for operators looking to maintain the integrity of their downhole equipment or mud pump consumables.
“We’re still using old technologies to quantify drilling fluid properties,” Mr Norman said. “Real time is where the industry is going: real-time hole cleaning, real-time dilution economics, real-time waste management volumes, real-time solids removal efficiency. There’s a digital transformation happening.”
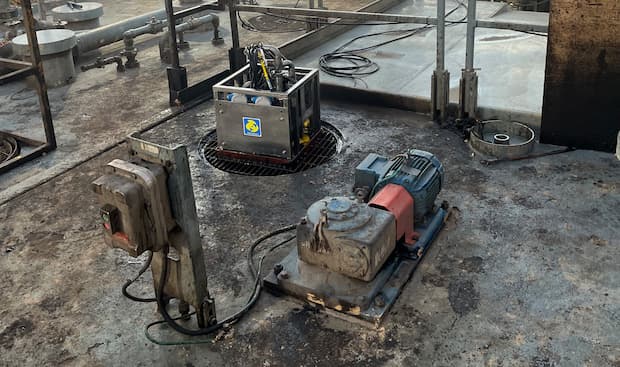
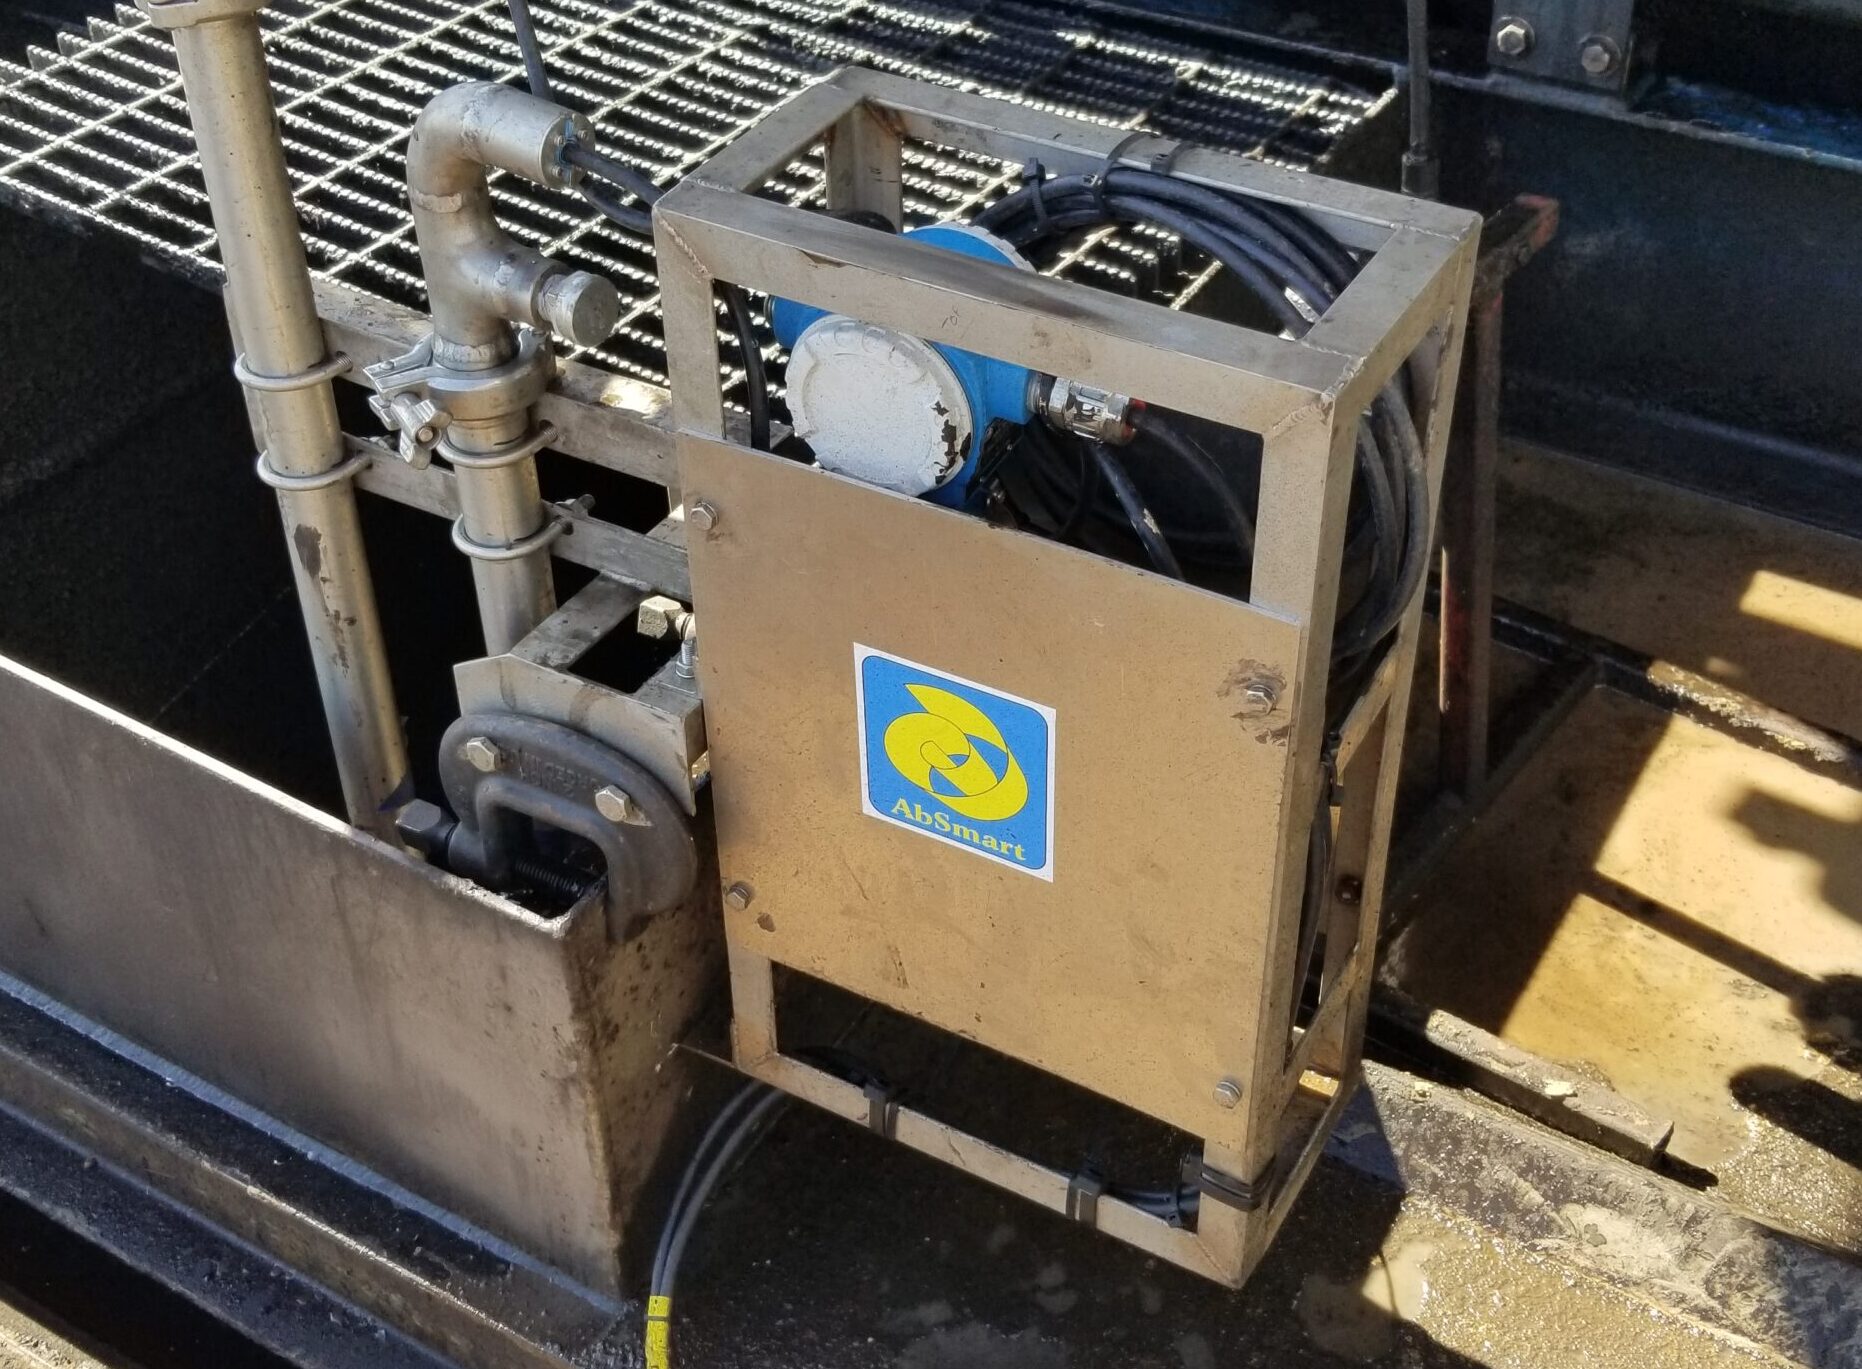
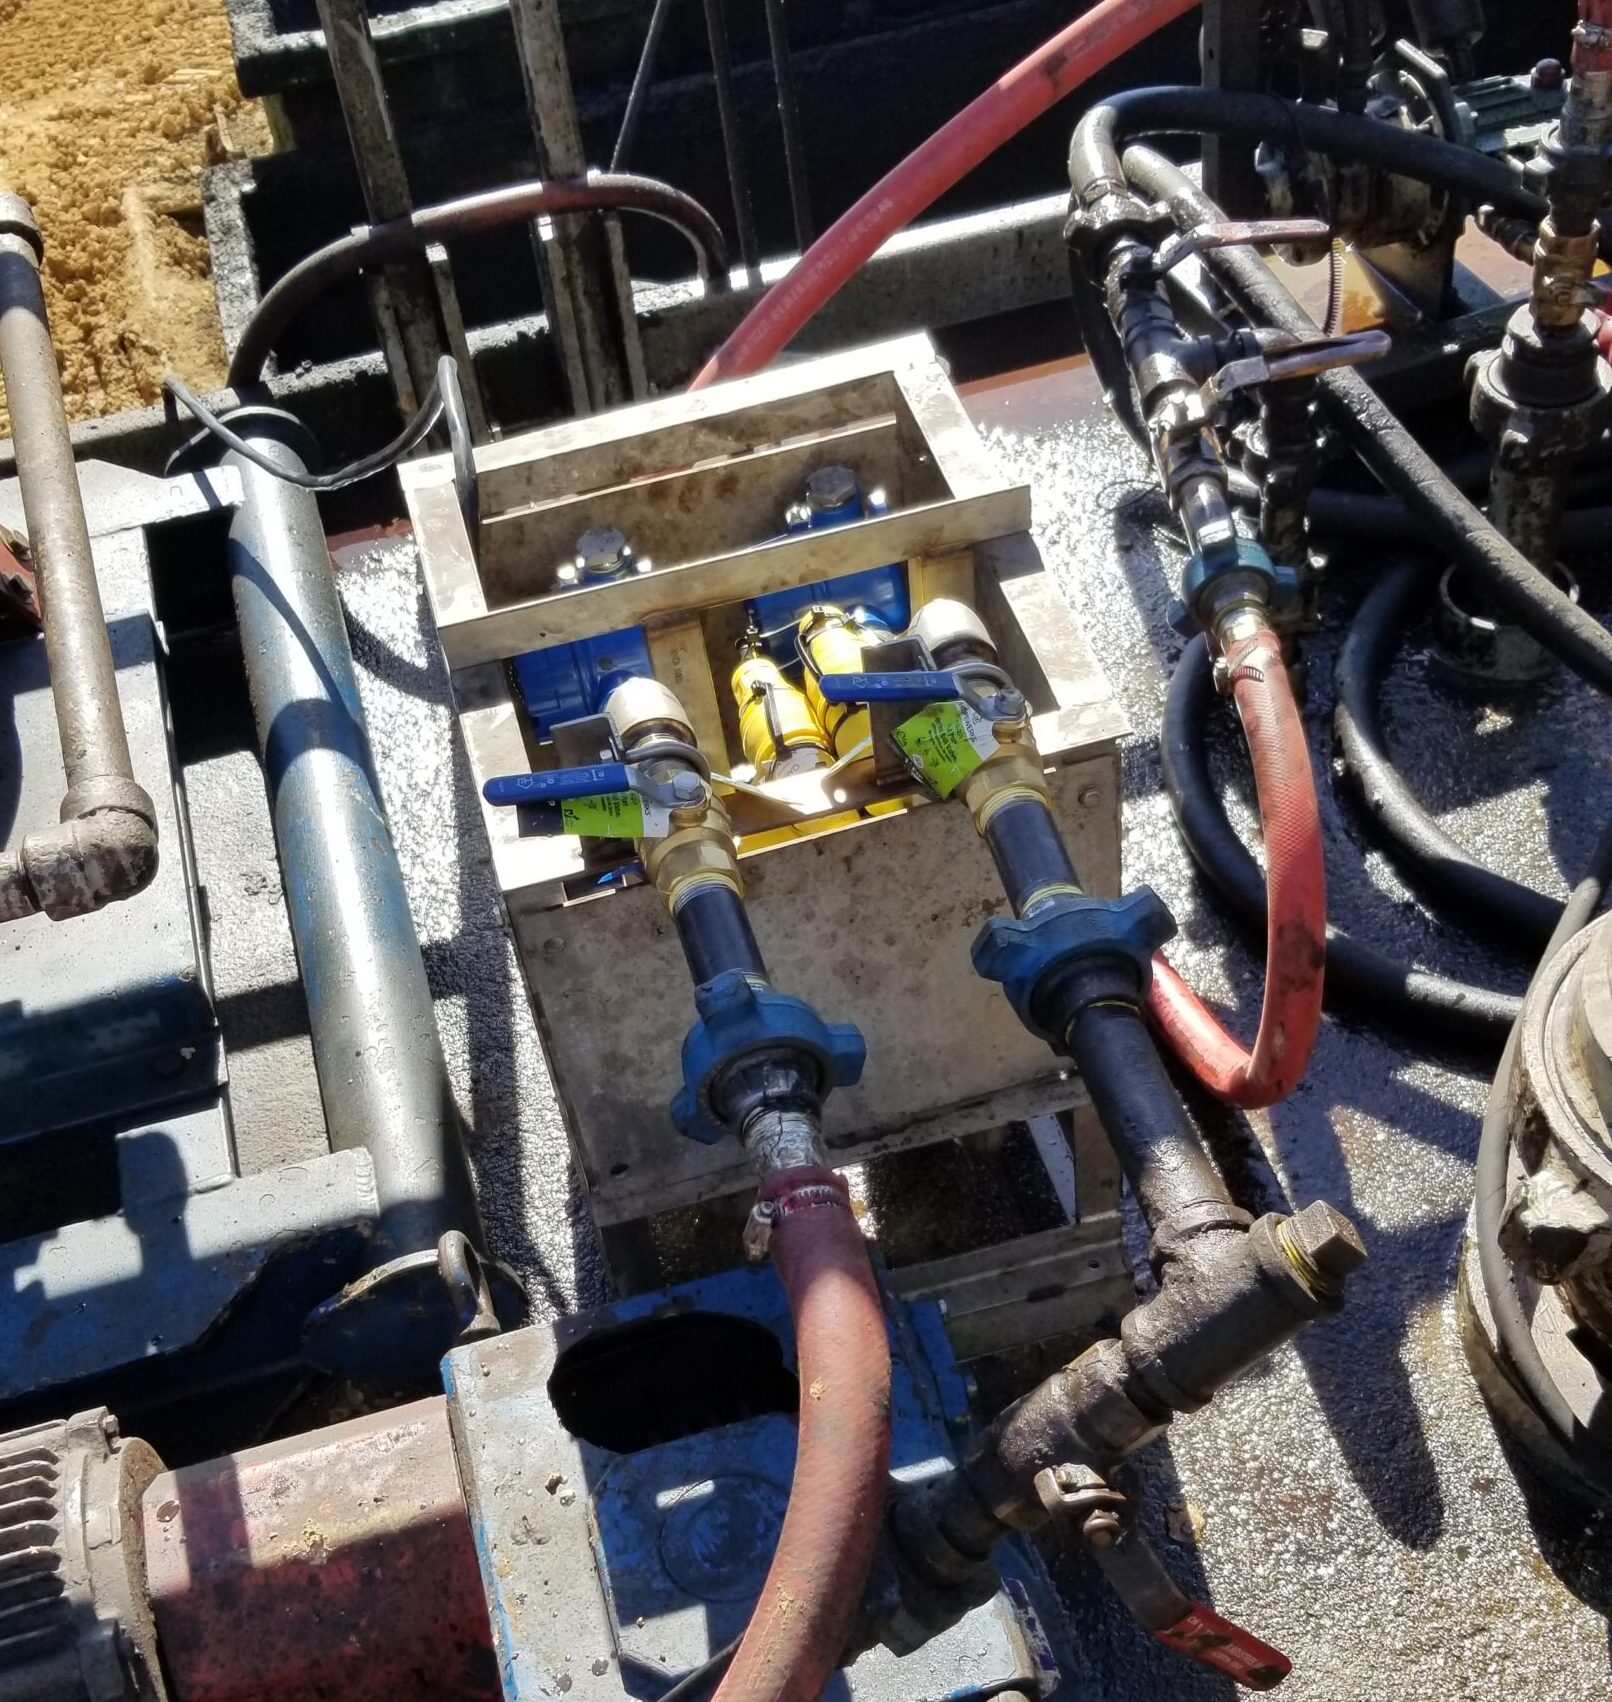
Absmart uses sensors that are installed in the active mud tank and the flowline. Two years ago, the company introduced four sensors TPA sensor (triple probe array) that measures density at the mud pump suction; SiCon sensor (simultaneous concentration) that measures the percentage of oil, water, low-gravity solids (LGS) and high-gravity solids at the mud pump suction; PBD sensor (possum belly density), which measures density at the flowline; and AFH sensor (annular flow height), which measures mud density in the primary shaker effluent tank.
Absmart began its work sourcing sensors in 2017, the year the company was founded. It tested several sensors, both in lab settings and in the field, with field trials conducted in the Permian and the Bakken. At first, the company focused on testing lower-cost sensors – Mr Norman said the company initially believed a low-cost solution would make its service more palatable to operators. However, it ultimately settled on sensors that provided the highest accuracy in measurement with the lowest probability of failure.
“What we have found with the low-cost solutions is that they just wouldn’t hold up to the harsh measurement environment. They would measure for a little while, maybe two or three wells, but you could see the data quality dropping off in due time. What we realized is that these sensors would really have to be low cost/disposable so that every three wells you’re throwing them away. That didn’t make any sense,” Mr Norman said. “So, we went with the more expensive solution because it has the highest repeatability and best data quality we found.”
The sensors are just one part of the fluids measurement picture. Mr Norman said that the data analytics Absmart provides from the sensors is what really drives the value. The company’s personnel analyzes various data points from its remote center in Houston and submits daily reports to operators chronicling key efficiency metrics.
Measuring the data
One such metric is the compositional material mass balance deliverable, or a model illustrating the amount of solids and liquids present in the drilling fluid. Another metric is hole-cleaning efficiency, or the mass of drilled solids removed divided by the mass of drilled solids generated. This KPI is computed using flow rate, density, and the mass of low-gravity and high-gravity solids going in and out of the well in real time.
“When you examine well delivery workflow, you can be very good at removing rock from the well (good hole-cleaning efficiency) but be very poor at removing rock from the mud (poor solids removal efficiency),” Mr Norman said. “Typically, we move mud from the reserve pits, adding diesel, water, lime, emulsifier and other products, and conventionally we don’t have any digital data to do a good job at managing volume reconciliation accurately. When you can do a good reconciliation of all the fluid movements on surface, you can better determine the mass balance of everything that’s going in and out of the well.”
Yet another metric the company analyzes is solids removal system performance, or solids removal efficiency from the active mud system. This metric is a function of shaker screen selection and centrifuge utilization. The mass of LGS is tracked through the process of mud product additions, volume transfers to and from frac tanks, new drilled cuttings produced, and drilled solids removed as waste.
The reports also include an analysis of particle size distribution, which Mr Norman said is a telltale sign of the fluid being recirculated down the well – the higher the percentage of ultrafine particles detected in the fluid, the more likely an operator will experience equipment wear and erosion issues in due time.
In addition, Absmart measures quartz content and barite concentration in the mud system, which Mr Norman said were valuable tools in evaluating solids removal efficiency. Barite can contain more than 20% LGS, of which 10-12% can be quartz, the most abrasive particle in the mud system. Because of the angularity of these particles, quartz concentration can have the most damaging effect on downhole tools and mud pump consumables.
By measuring flow rate, density, oil, water, barite and drilled solids, Absmart can generate a compositional material mass balance of all components entering and exiting the well. This is essentially a holistic accounting of how much of any given material is present in the drilling mud at any given time. By having this data available in real time, operators can have an immediate understanding of just how clean the hole is, Mr Norman said, and that can have a significant impact on their decision making.
“Our clients are paying attention to the real-time traces,” he explained. “They’ve been making decisions based on our data. As an example, the mass balance data is being used to determine when is the most appropriate time to pull out of hole on a wellbore cleanup cycle. Historically our client was circulating for more than 3 hours on every cleanup cycle, until the data became compelling enough to shave 1.5 hours of circulating time off every cleanup.”
Current work
Absmart is working with a major operator in the Denver-Julesburg Basin in Colorado and is set to begin work with another major operator in the Haynesville Shale in March. Further, the company is in talks with yet another operator to provide services for select wells in the Eagle Ford.
For the Colorado job, which began in October 2023, Absmart has data from multiple pads, all containing horizontal wells, illustrating the effectiveness of its system in evaluating hole-cleaning efficiency. The wells were all drilled to approximately 18,000-ft total depth, with an average ROP of 800 ft/hr and an average flow rate of 650 gal/min.
Monitoring multiple wells consecutively, the operator noticed a consistent decrease in mass rate out, mass rate in-out delta and mass rate in-out delta totalizer. This mass rate data corresponds to a decrease in density out, decrease in torque and a decrease in standpipe pressure upon bottoms up.
These findings suggested that the sensor data for mass rate was far more sensitive than the conventional visual evaluation the operator used when monitoring the shakers for cuttings removal, Mr Norman said, confirming that mass balance data is becoming a key metric as an indicator of a clean wellbore.
“For that job, they’re drilling a well in 48 hours, top to bottom, and moving the rig to the next location in the field. That’s an incredible amount of speed, and we had to find that sweet spot where we could get the measurements that showed them when their hole is clean,” Mr Norman said. DC