No end in sight for market volatility
In the face of continued supply increases, reduced CAPEX spending and record-high storage, industry begins to organize itself around lower prices for the longer term
By Katie Mazerov, Contributing Editor
The roller coaster ride the oil and gas industry has been on the last eight months has all the twists, turns and anxiety of an amusement park thrill ride – without the thrills. Significant volatility is evidenced by daily, sometimes hourly, price swings, falling rig counts and a continued supply glut. All this points to an uncertain, and potentially rough, road ahead, at least through the third quarter of 2015, industry analysts predict.
While the US unconventional boom and a slowdown in the global economy, notably China, have frequently been cited as culprits in the market downturn, most experts believe the picture is significantly more complicated. Some suggest that continued production in several sectors is fueling supply. Record-high storage inventories, diminished global demand in some markets due to a rising US dollar and what one analyst terms “an extremely severe amount of austerity” in capital investment are all factors that must be considered when taking stock of the situation. Given the ongoing volatility, analysts are wary about forecasting, but don’t see a turnaround on the horizon anytime soon.
“We monitor the industry closely in terms of supply and the cost of supply, which is one of the key factors in determining where prices go,” said Matthew Jurecky, Head of Oil and Gas for research and consulting firm GlobalData. “From that perspective, we do see challenges through the rest of the year because supply is still very strong. At $50/bbl, we haven’t seen sufficient impact to change the overall profile. Globally, there were several growth stories that were partially responsible for the fall in oil prices, and they persist.”
These include:
 • US tight oil and gas: “Although rig counts have fallen, they have significantly fallen in the areas where there were more conventional opportunities. The production growth rate, although slowed, has not fallen as much as people would have thought given the corresponding rig count drop,” he said.
• Russia: “Despite the drop in prices, economic sanctions and restrictions on securing capital for development, Russia has continued to increase production,” Mr Jurecky said. “During the most tumultuous period of price declines, July 2014 to January 2015, Russia’s production increased from 10.4 million bbl/day (Mbpd) to 10.7 Mbpd.” Russian operator Rosneft has remained steadfast in moving forward with a project in the Arctic’s Kara Sea, believed to hold up to 150 million bbl of recoverable reserves. Still, the impact from the departure of partner ExxonMobil in the wake of sanctions against Russia and the drop in oil prices, has been felt. “Rosneft’s plans have slowed recently due to lack of access to capital and the timing of new projects in light of short-term objectives to grow production.”
• North Sea: “Some projects that people thought would struggle to make economic sense have persisted. The North Sea is a mature basin, and while major capital investment has deteriorated in recent years, the cost of maintaining existing projects is quite low. Operations to increase recovery in certain fields will continue,” Mr Jurecky said, noting that Statoil’s Johan Sverdrup project in Norway is expected to come on stream in late 2019. It will be largest producing field in the North Sea when it reaches an estimated peak production of 500,000 bbl/day.
• Brazil: With significant offshore resources in place, deepwater presalt projects are moving forward, he said.
• Mexico: The country remains undeterred in leasing out its offshore fields, and there is a lot of interest in the upcoming bid rounds.
• West Africa: Angola and the Democratic Republic of the Congo are pushing to cross the 2 Mbpd mark and overtake Nigeria in production volumes, Mr Jurecky continued. “Angola has grown from 1.6 to 1.8 Mbpd over the past year.”
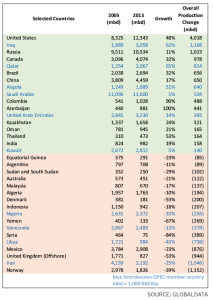
• China: “There are multiple views on the state of China’s economy,” he said. “The Chinese economy has declined in terms of the absolute growth rate, but even a 5-6% growth rate there is significant. Demand for oil is still rising, and China continues to increase production.” In 2005, China produced 3.8 Mbpd; at the end of 2014, the country was producing 4.5 Mbpd.
Elsewhere since 2005, US oil production increased by approximately 4 Mbpd; Russia increased production by a little over 1 Mbpd, and Canada grew output by about 1 Mbpd, Mr Jurecky noted. “After 30 years of difficulty, Iraq has increased production by about 2 Mbpd, becoming the second-largest producer in OPEC.” For the offshore sector, GlobalData currently lists 137 active or planned deepwater and ultra-deepwater projects across 29 countries.
International gas prices, which are linked to oil benchmarks, are relatively stable at $12 to $15/MMBtu due to long-term contracts, Mr Jurecky indicated. “However, the longer oil prices remain at current levels, the more likely gas will ultimately fall. We’re already seeing more parity between oil and gas prices.” Until 2005, ratios between Henry Hub and WTI had steadily maintained a ratio between 1-to-6 to 1-to-8. When the two indicators delinked, the ratio spiked to a 1-to-21 ratio. “New gas contracts are showing a negative trend, prompting some operators to push for again de-linking gas prices from oil.”
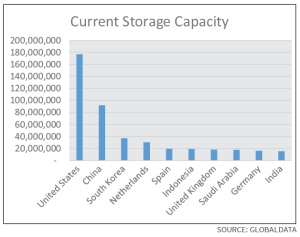
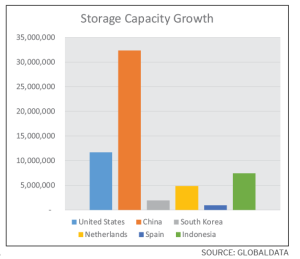
In March, storage capacities reached record highs, suggesting prices could plunge even further. “Excluding the strategic reserve, the US has 177 cu m of capacity, compared to 92 cu m in China and between 15 and 30 cu m for Western Europe,” Mr Jurecky said. “By 2018, US storage capacity will grow to 188 cu m, while China will expand to 124 cu m. The lowest cost storage is onshore, but with those facilities already at capacity, operators are turning to offshore storage,” he said. “Rates for large storage tankers started rising last year, reaching multi-year highs in February, and are now in short supply. Once capacity is filled, there will likely be additional downward pressure on oil prices, and that may be what breaks the back of the supply.
“The market is bound to bottom, and the industry is now organizing itself around lower prices for the longer term,” he continued. “But the market has a way of surprising everyone, either by the magnitude of the fall or growth, with catalysts ranging from the impact of storage to geopolitical events.” The pending deal, and subsequent lifting of sanctions, with Iran on nuclear weapons could, for example, have long-term supply ramifications as the country has massive reserves.
Sustained activity in Middle East
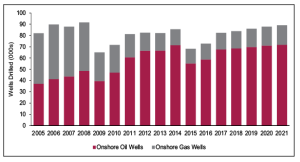
Rig counts have historically been a key market indicator, and for the last five months, the count has fallen steadily. The steepest declines have come from the US and Canada. As of 2 April, the US land rig count had dropped to 993 from 1,754 a year ago. In the same period, Canada’s rig count fell from 235 to 100, while the Gulf of Mexico (GOM) count went from 46 to 29, according to Baker Hughes. The international rig count for February was 1,275 versus 1,341 for February 2014, with the Middle East being the only region where counts are up, 415 compared with 396 in the year since February 2014, Baker Hughes reported.
Land rig counts and economics are markedly different internationally than in the US. Whereas the US rig count has dropped by more than 40%, to the lowest level since April 2011, the active land rig count internationally dropped by only approximately 3% from 2014 to 2015, according to Matthew Cook, Researcher for global market research and consulting firm Douglas-Westwood. “Much of the drilling activity is being sustained by the Middle East, especially Saudi Arabia defending its market share,” he said.
“Saudi Aramco can absorb the downturn in prices because the Saudi government has huge monetary reserves built up over decades of exported oil,” he continued. “Some US operators have less than 10 years of success behind them, meaning they have less capital and find it difficult to defend their share. Saudi Arabia’s low lifting costs, usually less than $10/bbl, combined with huge fields that produce oil easily without stimulation and with flow rates 10 times that of a well in the US, all contribute to the overall profitability of a well.”
With more than 1,000 active land rigs, China is also continuing drilling campaigns, despite the reported manufacturing slowdown. “National oil companies there and elsewhere have a lot more money to play with than many independents in the US,” Mr Cook said. Meanwhile, service companies are being asked to negotiate prices, and in the US, the “sheer number of wells has driven service prices down.
“Most major IOCs have significantly cut their CAPEX spending,” he added, suggesting global demand is not the issue. “The world has not decided it doesn’t need oil and gas, but the margins between supply and demand are very small, and any slight change in that triggers big price swings.” For example, oil prices spiked briefly when militants took over the Mabrouk field in Libya in early March.
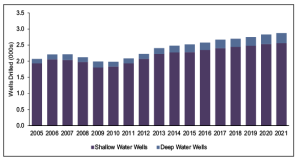
Offshore, the influx of new drillships and semisubmersibles, commissioned in anticipation of booming deepwater and ultra-deepwater activity, has contributed to a 10% drop in global utilization for the three main rig categories, from a peak of 89% in January 2014 to the current figure of 80%. “Drillships have shown the steepest decline, at 15% in the last 14 months, with jackups showing a lesser drop. Semisub utilization has been sustained over the past year,” Mr Cook said. “Utilization varies regionally. Rig dayrates are very exposed when oil prices fall, but contractors may not realize the full impact for another two to three years because of the long-term nature of offshore contracts.”
IOCs will concentrate on established oil and gas sectors – West Africa and the GOM for oil and Southeast Asia and Australia for natural gas – where they can collaborate on infrastructure for projects, splitting the cost, he said. Anadarko began production in January in the GOM’s deepwater Lucius facility in the Keathley Canyon region, estimated to hold more than 300 million BOE of recoverable resources. In late March, Chevron’s $5.1 billion Big Foot platform began development drilling in the Walker Ridge area.
“Frontiers such as East Africa and the Arctic, including Alaska and the Barents Sea, will suffer because there aren’t a lot of companies able to collaborate on building infrastructures,” Mr Cook added. An exception could be Shell, which in March received approval from the US Department of the Interior to resume oil exploration in the Chukchi Sea in the Arctic Circle.
North Sea investment also has declined due to maturing fields and lack of discoveries, particularly in the UK. Last year, even before the drop in prices, Chevron shelved the Rosebank project in the West Shetlands due to escalating project costs. “Our view on that project is quite dim, as we don’t expect to see any oil and gas production until 2020 or later,” Mr Cook said.
While less capital could result in a decrease in mergers and acquisition (M&A) activity, smaller companies that are struggling because of lack of cash reserves may be looking for buyers with more capital, he said.
Severe CAPEX austerity
M&A activity has been minimal over the past eight months, a trend that is likely to continue for the near term, said Pavel Molchanov, Energy Analyst for Raymond James. “When oil prices get cut in half, everyone feels the pain, from the multinationals on down.” Continued low prices also are dampening consolidation, at least for the near term. “What we’re seeing now, especially in North America, is a wide bid-ask spread, meaning sellers want more for their assets than what buyers are willing to pay,” he said.
A key indicator in the market’s eventual recovery centers on CAPEX spending and investment, Mr Molchanov contends. “We’ve been saying since the beginning of the year that oil prices will bounce along the bottom during the first half of 2015, then begin a more durable, sustainable recovery in the second half of the year and into 2016,” he said. “Right now, the really big question is not where oil is going to be a week or a month from now, but where it is going to be at the end of the year, because that is when budget decisions are going to be made.”
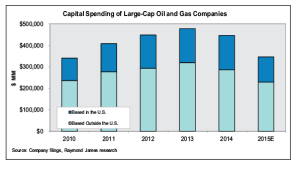
Raymond James’ annual CAPEX Survey, released in March, reported a 20-25% decline in global upstream spending this year. The US onshore market’s decline was roughly double that amount, cutting close to 50% in spending, back to 2010 levels. The reduced spend is especially evident given that up until mid-2014, the pace of drilling and investment activity was “escalating out of control for a considerable length of time,” Mr Molchanov said. “Between 2010 and 2013, non-OPEC investment was up 40% and even more than that in the US.
“The current level of austerity, which is visible globally, will eventually impact the supply curve in a significant way, and it is not sustainable,” he continued, noting there is less visibility on capital spending in the OPEC countries. “Our view is that oil prices will need to be meaningfully higher by Q4 to support a more sustainable level of investment in 2016. That level will depend in part on service costs, but we suggest WTI prices in the $60s/bbl range, and Brent correspondingly higher.”
On a year-over-year basis, Raymond James predicts US supply will remain high through Q3 and will flatten out by end of the year. “If the current level of austerity does not improve next year, then US supply will be down for 2016,” Mr Molchanov noted. The rest of the non-OPEC market is a “mixed bag,” with areas like the North Sea, Mexico and Argentina already in decline, and others, notably Russia, growing slowly. “We believe non-OPEC supply will be down year-over-year by the end of this year and will decline on a full-year basis in 2016 if activity doesn’t pick up.”
A slowdown in CAPEX spending is likely to impact long-term development projects, including deepwater, oil sands and liquefied natural gas. “Companies that have long lead-time projects in construction will still take them to fruition, but for projects that were in the planning stages and waiting for final investment decisions, those investment decisions in many cases are going to be postponed.”
Reshaping portfolios
The logic of completing and producing already-invested deepwater projects outweighs stopping or slowing construction, agrees William Arnold, professor in the Practice of Energy Management at Rice University’s Jones Graduate School of Business. “Companies have to consider their overall portfolios, debt position and marginal costs to produce oil against their sunk costs and price scenarios,” said Mr Arnold, a former Shell executive and international banker.
In assessing the impact of the current market, it is important to put it into context, Mr Arnold said, recalling recent price collapses in 1983, 1986, 1998 and 2008. “Volatility has been part of the industry since its beginning in the mid-1800s. The remarkable stability of oil in recent years may have anesthetized us to this. The causes and, therefore, consequences of each event differ, he noted. “In 2008, for example, the global financial crisis precipitated sharp economic decline, but recovery was robust.”
The most recent price collapse in both oil and natural gas can be attributed in large part to the “remarkable success of North American drilling,” along with a softening global demand and the fact that LNG exports have yet to occur, he said. At the same time, oil production in Iraq has reached a 35-year high, and output from Libya continues at a high level despite ongoing geopolitical issues. “Medium-term prospects aren’t encouraging because storage is nearing capacity, and the federal government, with few exceptions, still doesn’t permit crude exports.”
Globally, demand is also being diminished because oil prices are denominated in dollars, and the dollar is rising. “Typically, consumers are buying in local currency, so they have to pay more in euros or pesos or other denominations than would otherwise be the case,” he explained.
Technological advances, such as pad drilling, more efficient rigs and sophisticated LWD/MWD tools, have made the process of extracting hydrocarbons more efficient, while rig counts aren’t as reliable a predictor of near-term prices as they once were, Mr Arnold added. “Other factors have contributed to continued growth in production despite the precipitous drop in rig count,” he pointed out. “Some companies are producing even at negative cash flows to hold leases for which they paid a lot of money or in hopes that other companies will drop back first.”
This trend will likely set the stage for significant consolidation. “There will be tremendous activity, ranging from asset sales and swaps to mergers and acquisitions,” he said. “A handful of companies have already entered Chapter 11 bankruptcy, and others will cease operations. Tens of billions of dollars from private equity and companies with strong balance sheets are available now to rejuvenate the industry. Two major funds have already been announced, totaling about $15 billion combined. ExxonMobil sold $8 billion of new bonds, and investors are aware that others are prepared to move fast, so the trigger may be pulled quickly.”
In March, ExxonMobil announced plans to start up 16 major oil and natural gas projects in the next three years, with daily production increasing to 4.3 million BOE by 2017. In 2015, the company anticipates increasing production volumes by 2%, to 4.1 million BOE/day, with liquids growth accounting for 7% of that volume. This year, ExxonMobil will launch seven new developments, including Hadrian South in the GOM, expansion of the Kearl project in Canada and expansion of deepwater projects in Nigeria and Angola, according to a news release posted on the company’s website.
At the same time, the company projects a 12% cut in capital spending, down to $34 billion, for 2015, while annual capital and exploration expenditures are expected to average less than that in 2016 and 2017. “We are capturing savings in raw materials, service and construction costs,” ExxonMobil chairman and CEO Rex Tillerson said in a statement released by the company. “The lower capital outlook also reflects actions we are taking to improve our set of opportunities while enhancing specific terms and conditions and optimizing development plans.”
How drilling contractors and service companies choose to handle reduced rates depends on the near-and mid-term views of managers and boards and the strength of their balance sheets, Mr Arnold said. “Faced with the loss of a contract, equipment owners and employers would rather get some revenue rather than add the cost of decommissioning and laying off people, who were difficult to recruit just a year or two ago.”

