Software goes beyond graphs to offer virtual reality presentation of drilling data visualizations
System unifies real-time monitoring with analysis of data like drilling trajectory to deliver immersive experience for end users

By Stephen Whitfield, Associate Editor
Real-time monitoring of a well’s operational parameters and trajectory can help operators mitigate risk and improve the well’s performance. Most current monitoring software programs present data primarily in a graphical format, as track plots. However, adding an interactive or immersive visualization component would help operators and drillers better understand the data coming from the well, thus enabling faster and smarter decision making.
“We have sensors that read things, we’re generating large amounts of data, and the data that we’re receiving is not structured,” said João Humberto Guandalini Batista, Wells Technology R&D Manager at Repsol Sinopec. “We’re struggling to do something meaningful with this data. Our main challenge is to better use the data, translate it to something meaningful and make decisions based on this.
During the 2022 Offshore Technology Conference on 4 May, Mr Batista discussed Repsol Sinopec’s work developing a 3D visualization software program that can unify real-time monitoring and the analysis of charts, drilling trajectory, lithology and seismic data.
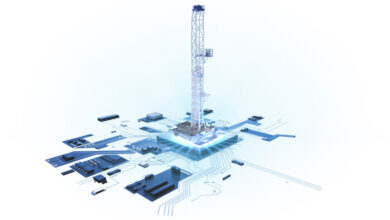
The Divisor program consists of a cloud platform that processes and stores data from different sources, as well as a digital 3D visualization module that can be used either as a traditional desktop interface with 3D visualizations, or as an immersive environment depicted in a virtual reality (VR) headset. Both formats allow users to view real-time and historical data in multiple ways, perform assessments and simulations. The VR mode also allows users to navigate through a full-scale visual environment, allowing for better data manipulation and better insights related to the data captured.
It’s believed these capabilities can enhance the interaction in troubleshooting activities and improve decision making at the well site.
“The project was done to restructure data, collect data from different sources and organize this data to be easy to install and easy to be used by people in different locations. As soon as we get the data and organize the data, we use machine learning to visualize it. Sometimes it’s difficult to make correlations based on only having graphs of data in front of you,” Mr Batista said.
Software development
The main function of Divisor is to centralize data from wells for use in real-time monitoring, Mr Batista said. It has modules both for Repsol Sinopec’s operated and non-operated wells. Data for operated wells are typically gathered from sensors placed along the well, while non-operated well data typically come from daily drilling reports, which are read and interpreted through machine learning algorithms.
Using the module for its non-operated wells, Repsol Sinopec users can classify information according to its own formatting standards – which are generally different from the formatting standards of the well’s operator. This ensures that all data are uniformly formatted before they are stored on the server.
The program was also designed to connect with other databases and servers, in particular WITSML servers where real-time data can be streamed. This connection capability allows users to access data that already exists in other databases, complementing the data from design reports. This data is then fed into simulators that process the data and store it in Divisor’s database.
Mr Batista said this capability to store data from multiple databases into a single location allows users to generate insights about a well’s operational conditions in a more practical manner. Users work through an application programing interface (API) to access data via either a web interface or a VR application.
The web interface application, where users can define connections with WITSML servers, inserts design data for each well section and visualizes results of past and real-time drilling data for all wells that are on the server. Users can search for a well, whether it is operated or non-operated, and launch the VR application.
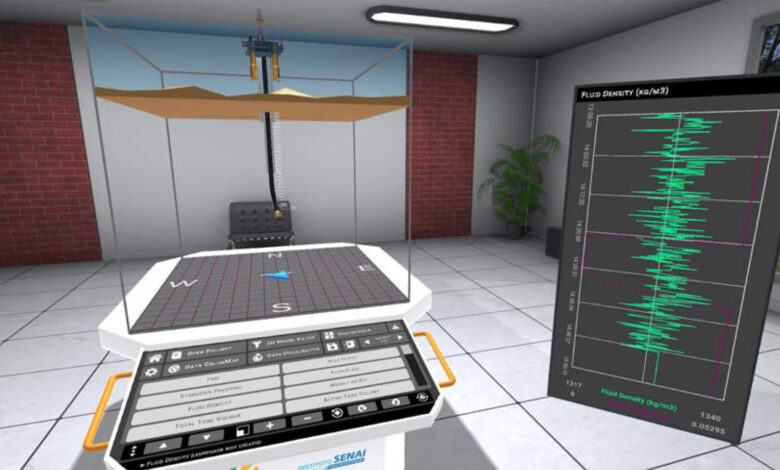
The VR application uses the API to access drilling variables in real time. These variables can be viewed either through a standard interface (for conventional computer screens) or through an immersive interface (for VR headsets). This app visualizes data related to monitoring geometry, trajectory and operational variables into a 3D representation of the well.
On top of that, users can view the geological lithology of the well, as well as seismic data. For lithology, users can view prognosis data, or data that comes from a previous analysis of where the drilling is being carried out – this can be either a complete or a partial well profile; or inferred data, which is data generated by the system without input from the user.
Mr Batista said this capability allows users to identify variations between the predicted lithology and the actual lithology
The standard interface can be controlled by a keyboard or mouse. The immersive interface requires specific controls on commercially available head-mounted displays. A virtual room serves as a working background – inside this room, the user can move around through the space. Using the controls, he or she can point to a location and instantly move to that location.
Future development
includes collaborative mode
The software is still under development, and there is no timetable for commercial release outside of Repsol Sinopec. However, last year the company tested and validated it on six operated wells, both offshore and onshore, successfully monitoring them in real time. Testing included analysis of certain parameters, including well path visualization, drilling stage visualization, and numerical information such as pressure and ROP, within the standard and immersive interfaces.
So far, the software has been well received within the company, Mr Batista said. Engineers have used the immersive interface to predict potential problems with a well and suggest improvements to the well’s operational parameters, which can be implemented by the rig crew.
Repsol Sinopec is currently working on enabling 3D comparisons of planned and executed projects, surface coloring to visualize pressures and other relevant data, and the predicted and simulated data provided by an artificial intelligence component and connected simulators. The company wants to expand the types of data the software can visualize, including data generated by AI and simulators.
In addition, Mr Batista said the company wants to incorporate the monitoring application with the web interface, allowing access to the monitoring tool through web browsers and expanding the access capability to the tool.
“We need to spend more time on the web interface. At the end of the day, that’s where people are primarily consuming the data. We’re spending more time on our mobiles in our daily routines, so we need to increase our algorithms. We have the opportunity to play more with new uses for the data,” he said.
Repsol Sinopec also wants to develop a “collaborative mode” within the VR interface, allowing two or more users to interact and work in the same scenario, monitoring the same well. Mr Batista said this capability would enable workers in different locations to interact with each other in real time with information provided by the drilling monitoring module. DC